Everything you need to follow your results over time.
From your first blood panel to years of history — organised, charted and compared. And every bit of it end-to-end encrypted.
Dashboard
Your health records at a glance
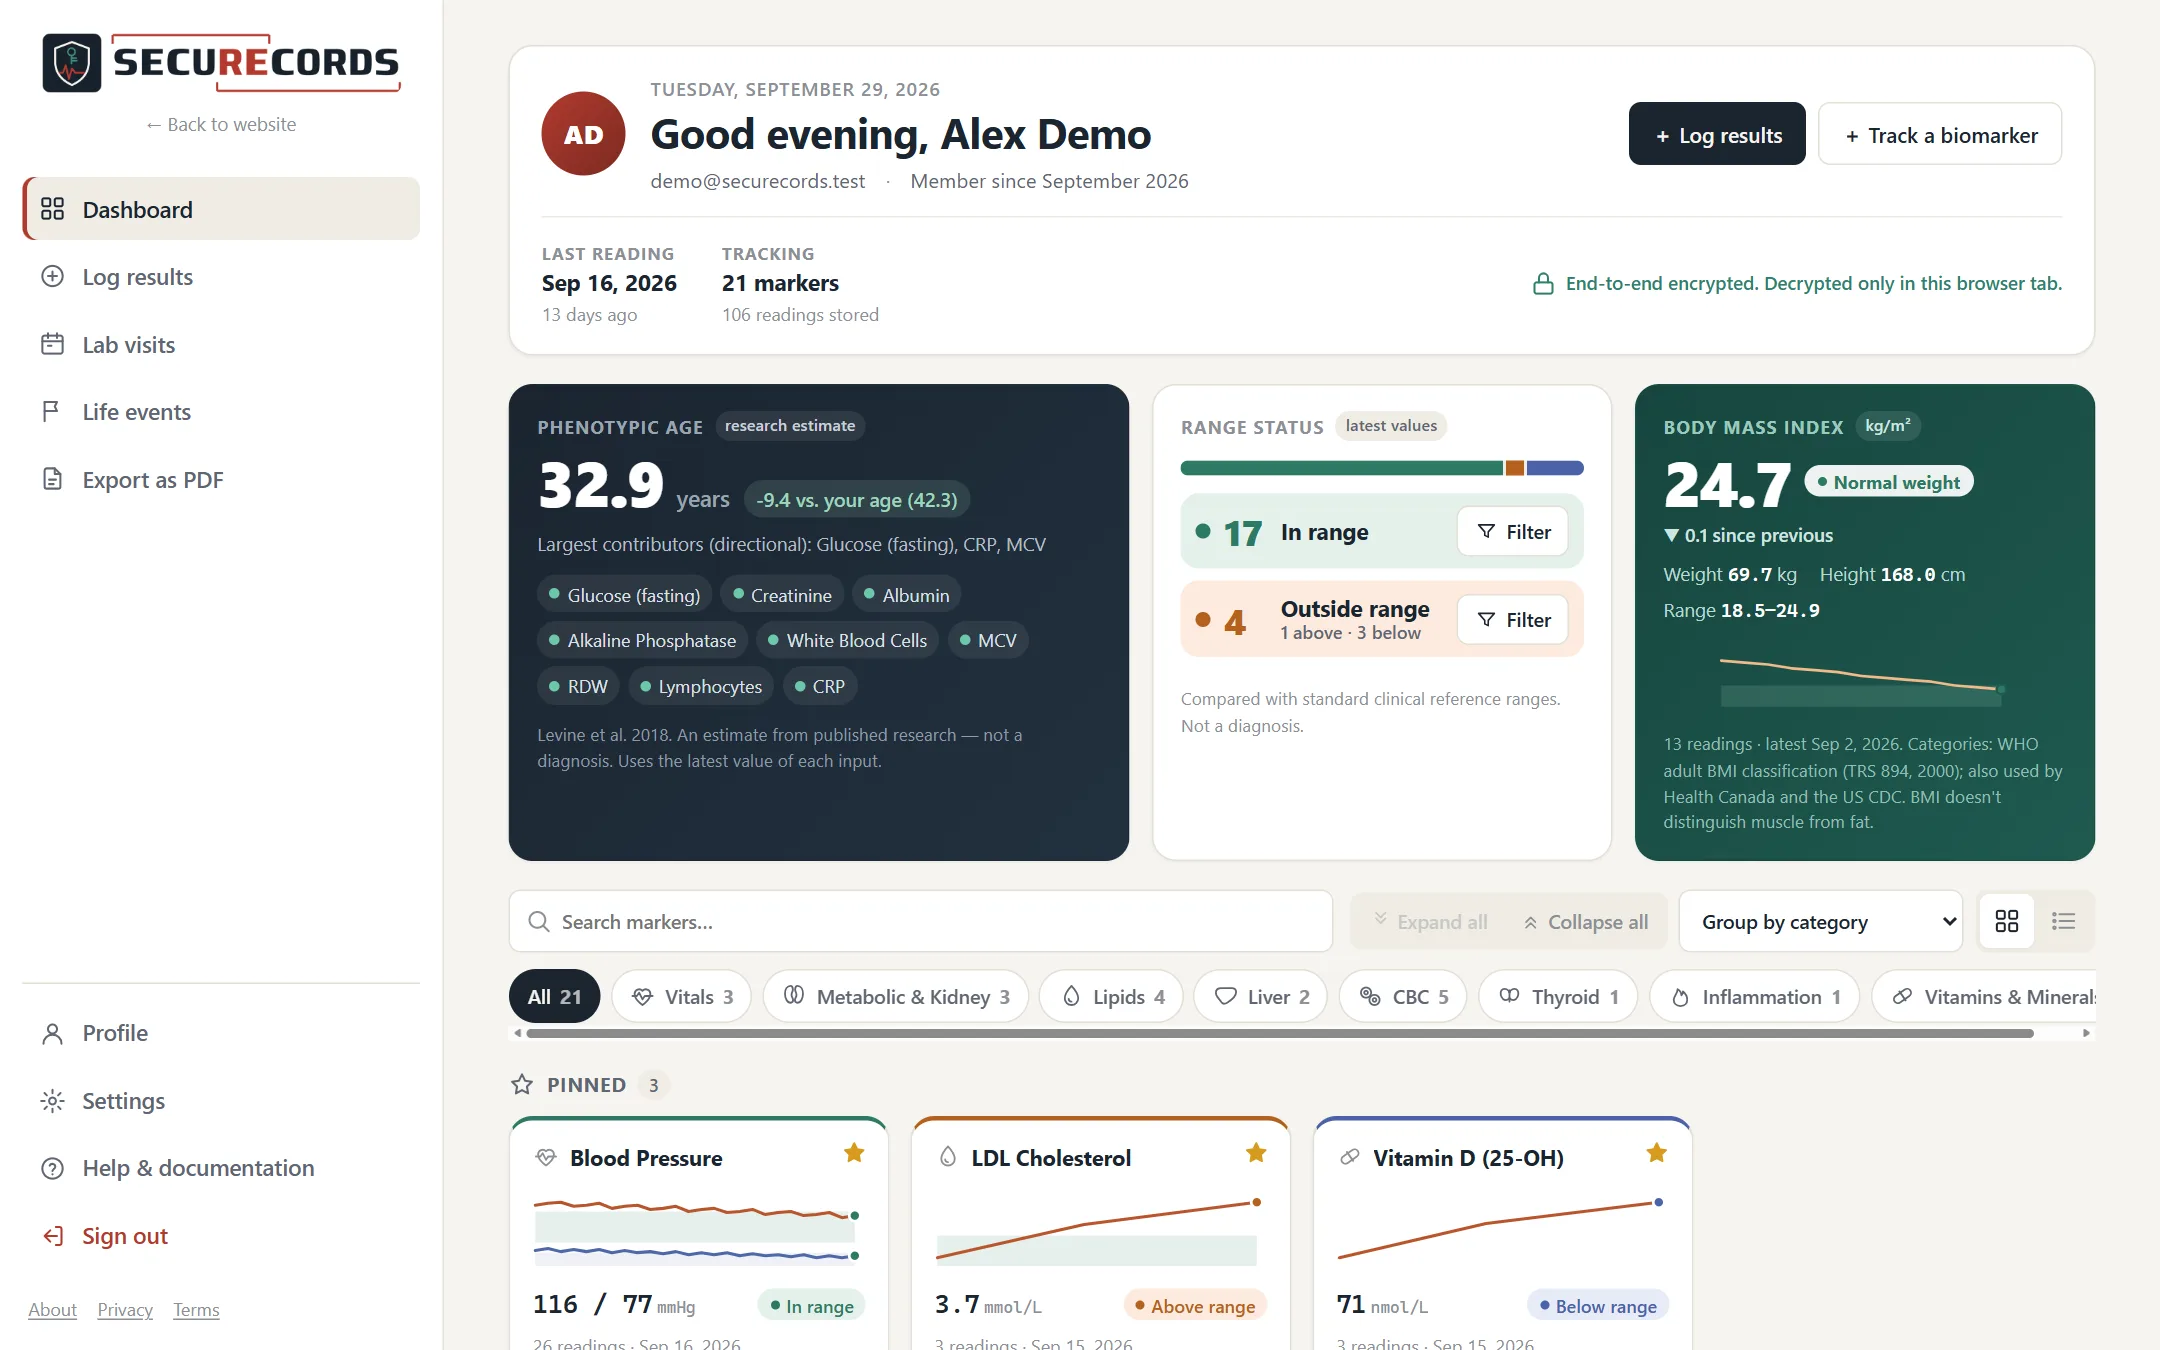
A card for every marker you track, showing its trend line, latest value and whether it's within the reference range.
Summary cards for Phenotypic Age, range status and BMI
One-click filters for markers inside or outside their range
Pin favourites, hide what you don't need, search and sort
Group by category with expand / collapse, or use a compact list
A personal greeting with your latest reading and totals
SECURECORDS
Marker details
Every marker, in depth
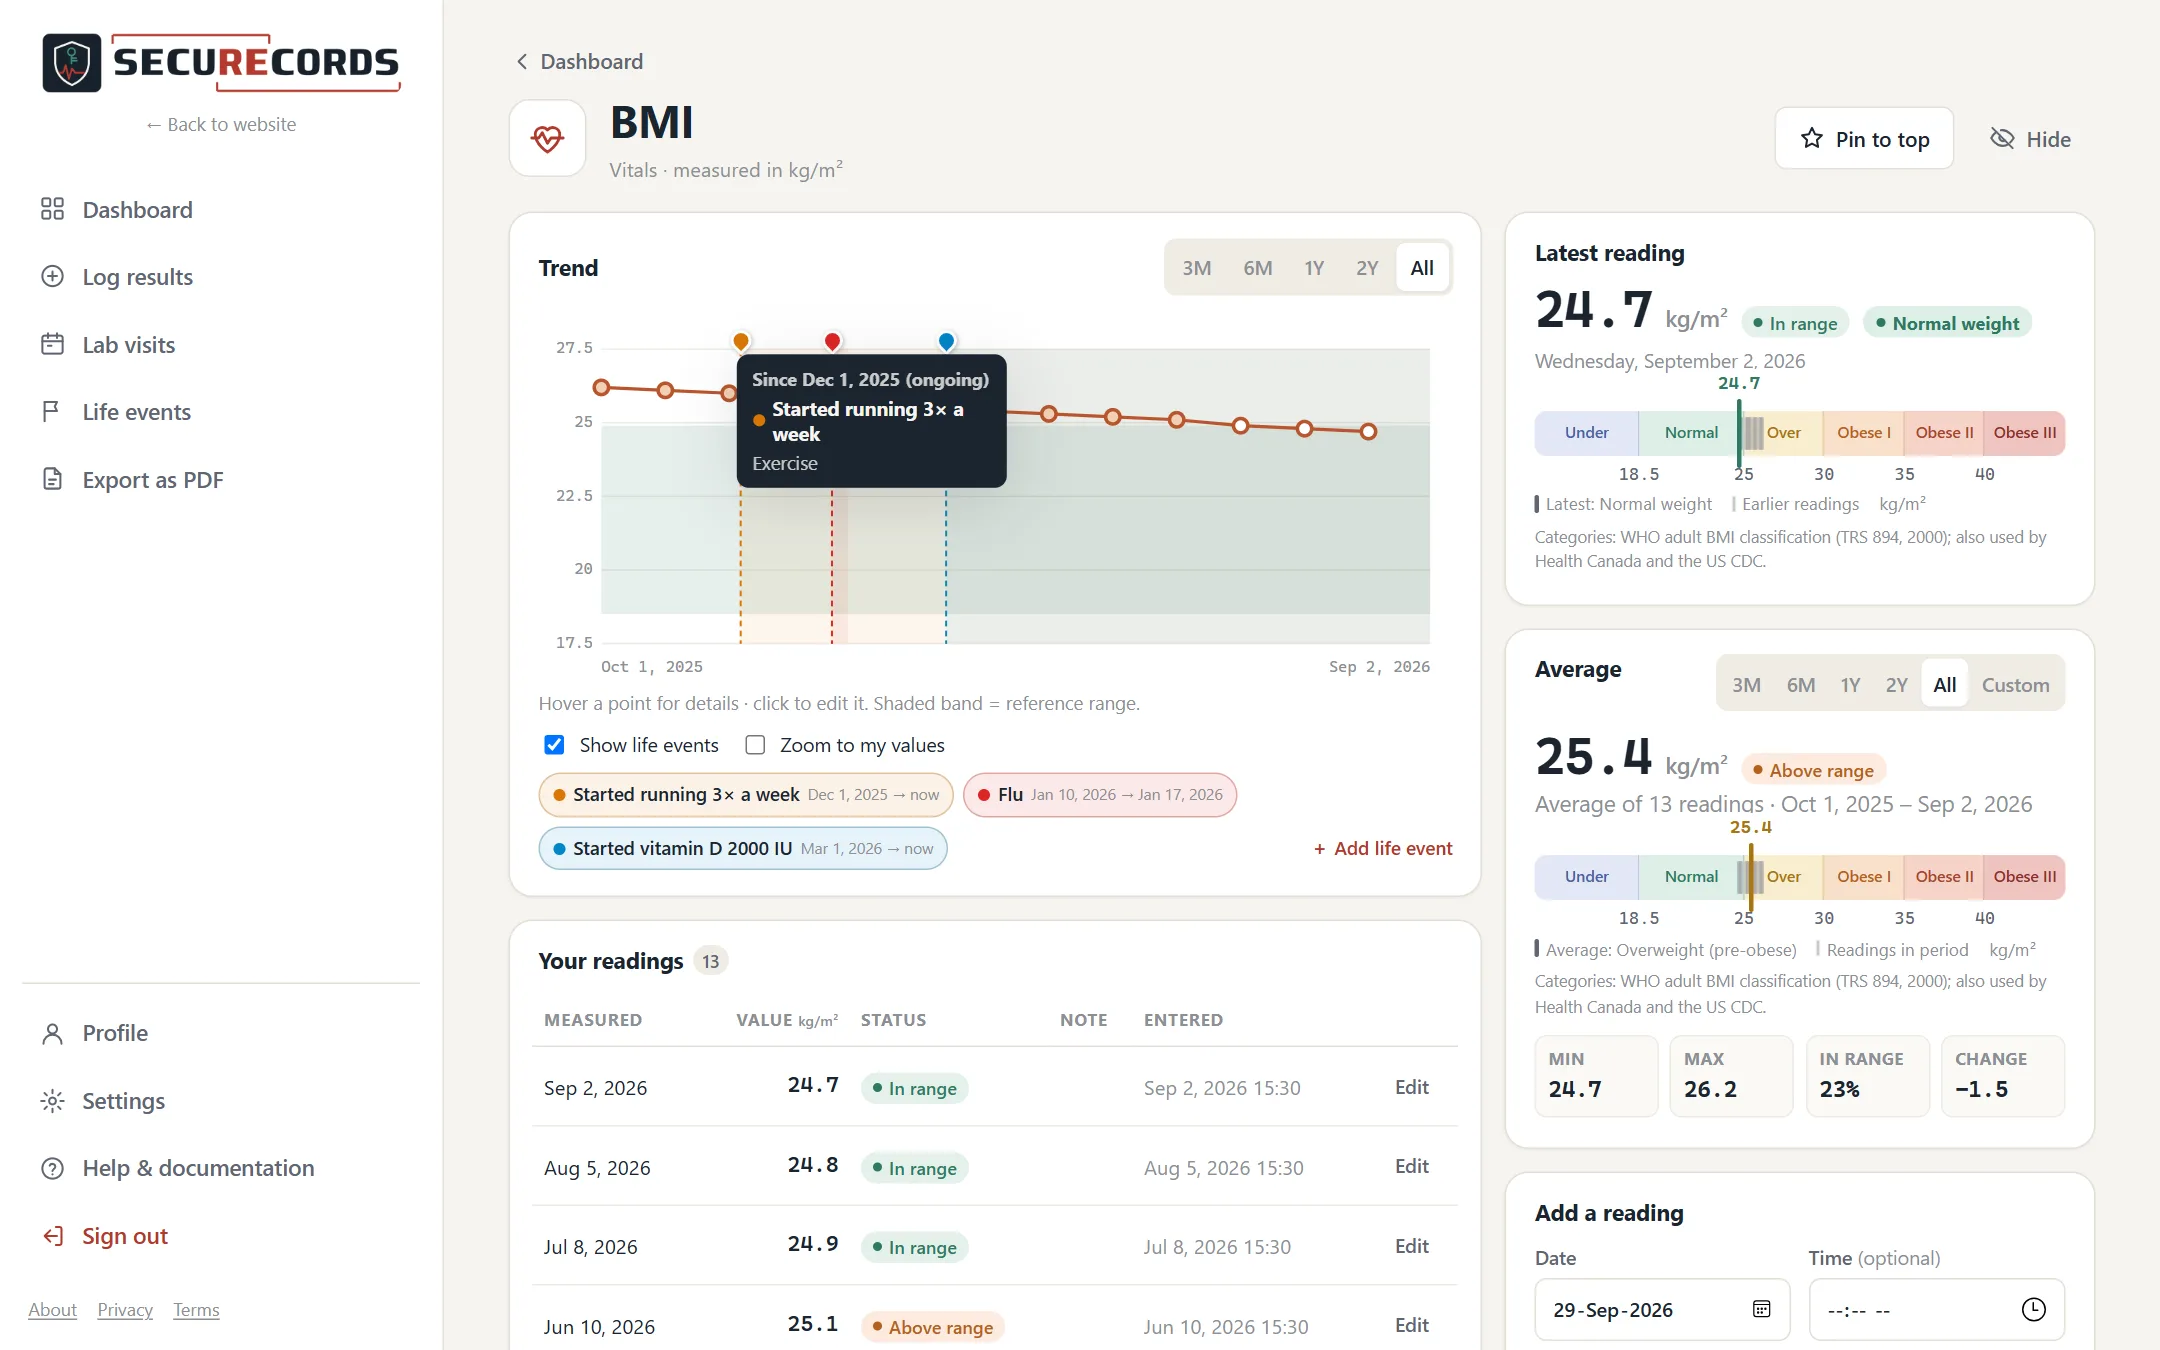
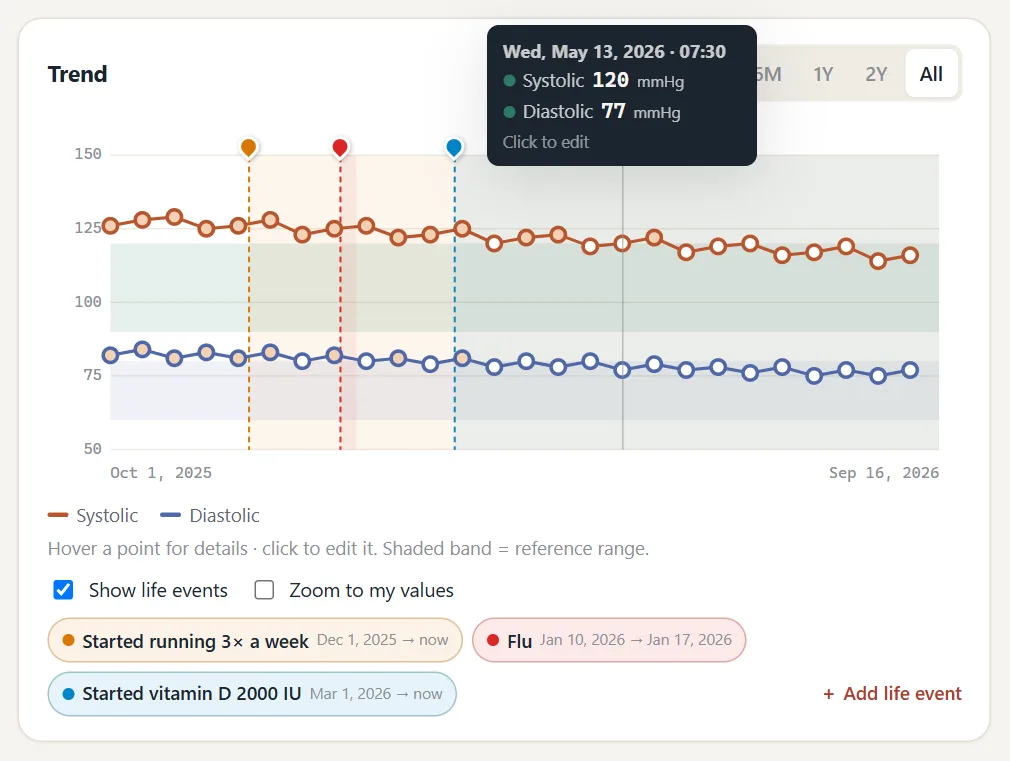
Trend chart — hover any point for its date, value and status; click to edit
Latest reading on a reference-range bar, with earlier readings marked
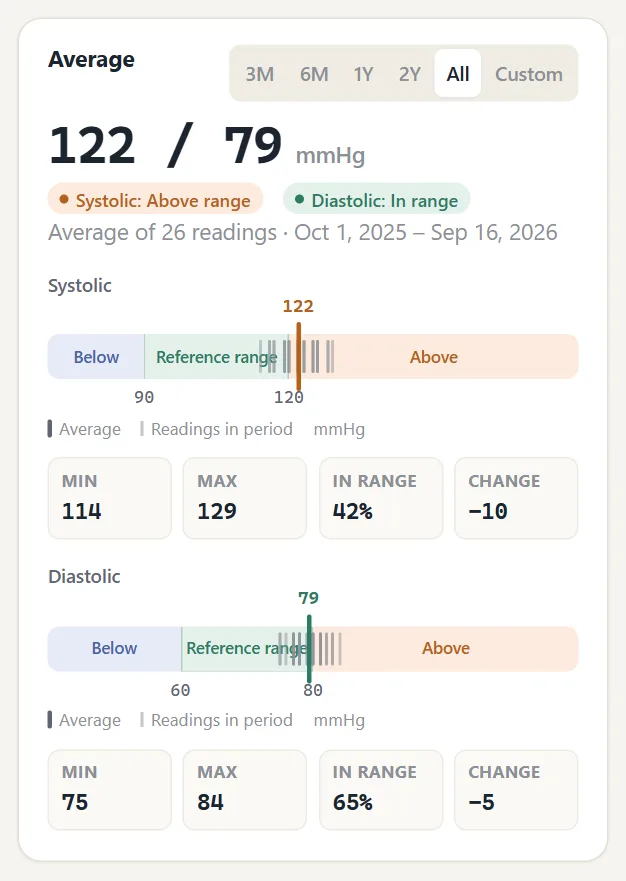
Average over 3, 6, 12 or 24 months, all time or a custom range — with min, max and time in range
Full readings table with dates, times, notes and edit / delete
Reference ranges by sex, or the range from your own lab report
Plain-language background on what each marker is and what can affect it
SECURECORDS
SECURECORDS
Hover any reading for its details.
SECURECORDS
Averages for any period, on the same range bar.
Logging
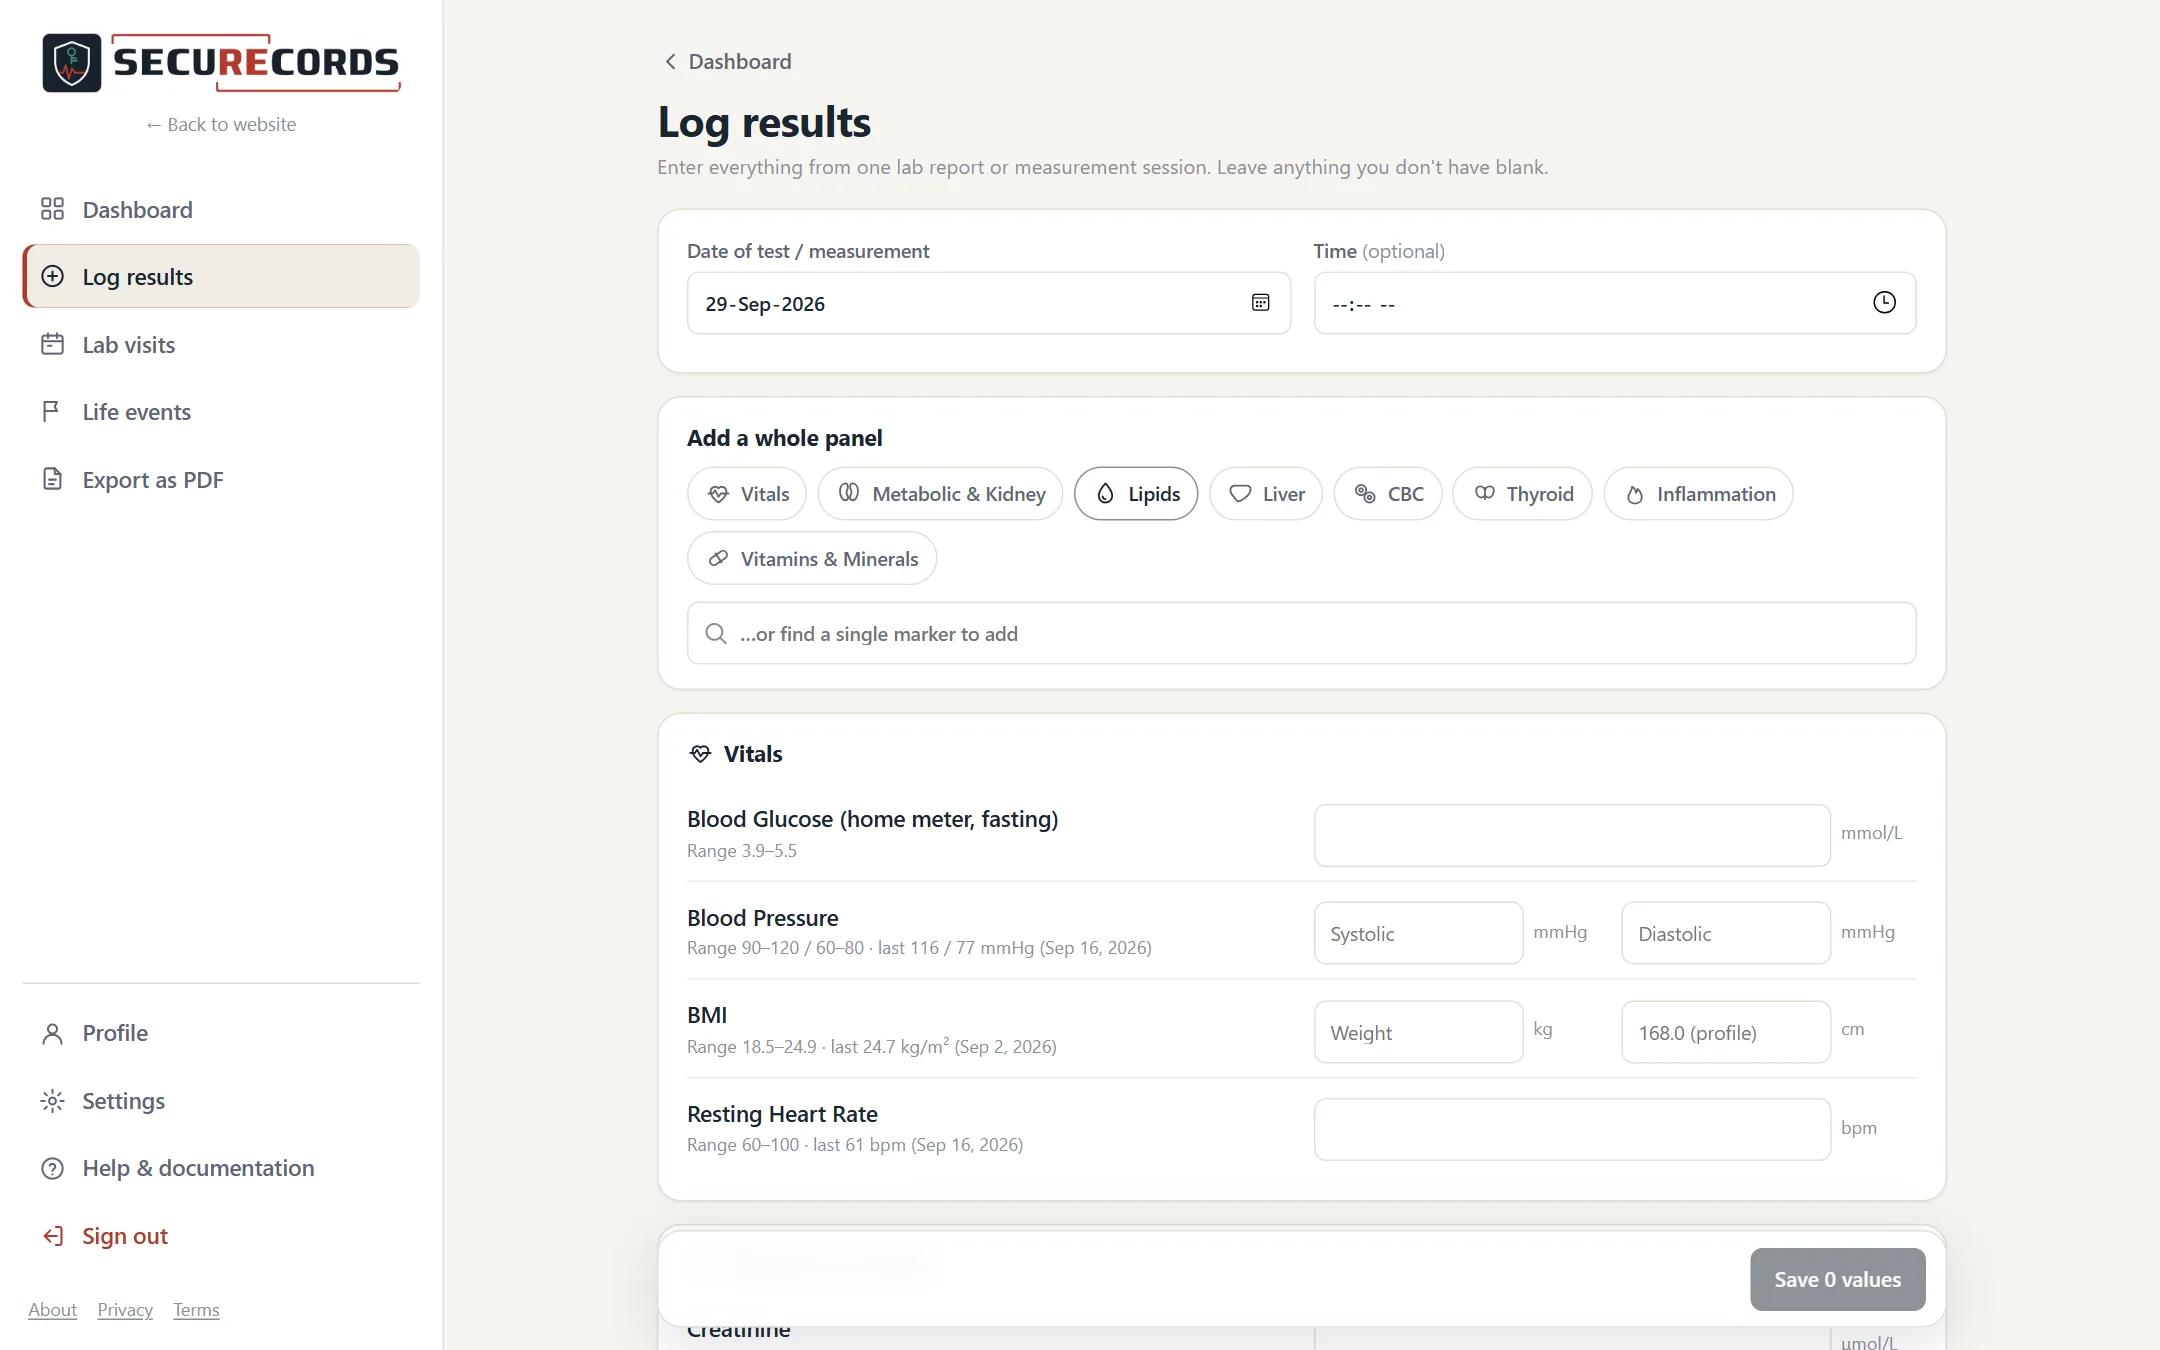
A whole lab report in one go
Pick the date, add the panels on your report — CBC, lipids, liver and more — and type the values. Each row shows its reference range and your last result, so mistakes stand out.
Blood pressure with systolic and diastolic in one entry
BMI from weight and height — your height is remembered
Optional time and notes (e.g. "fasting", the lab's name)
Custom biomarkers for anything not in the list
SECURECORDS
Lab visits
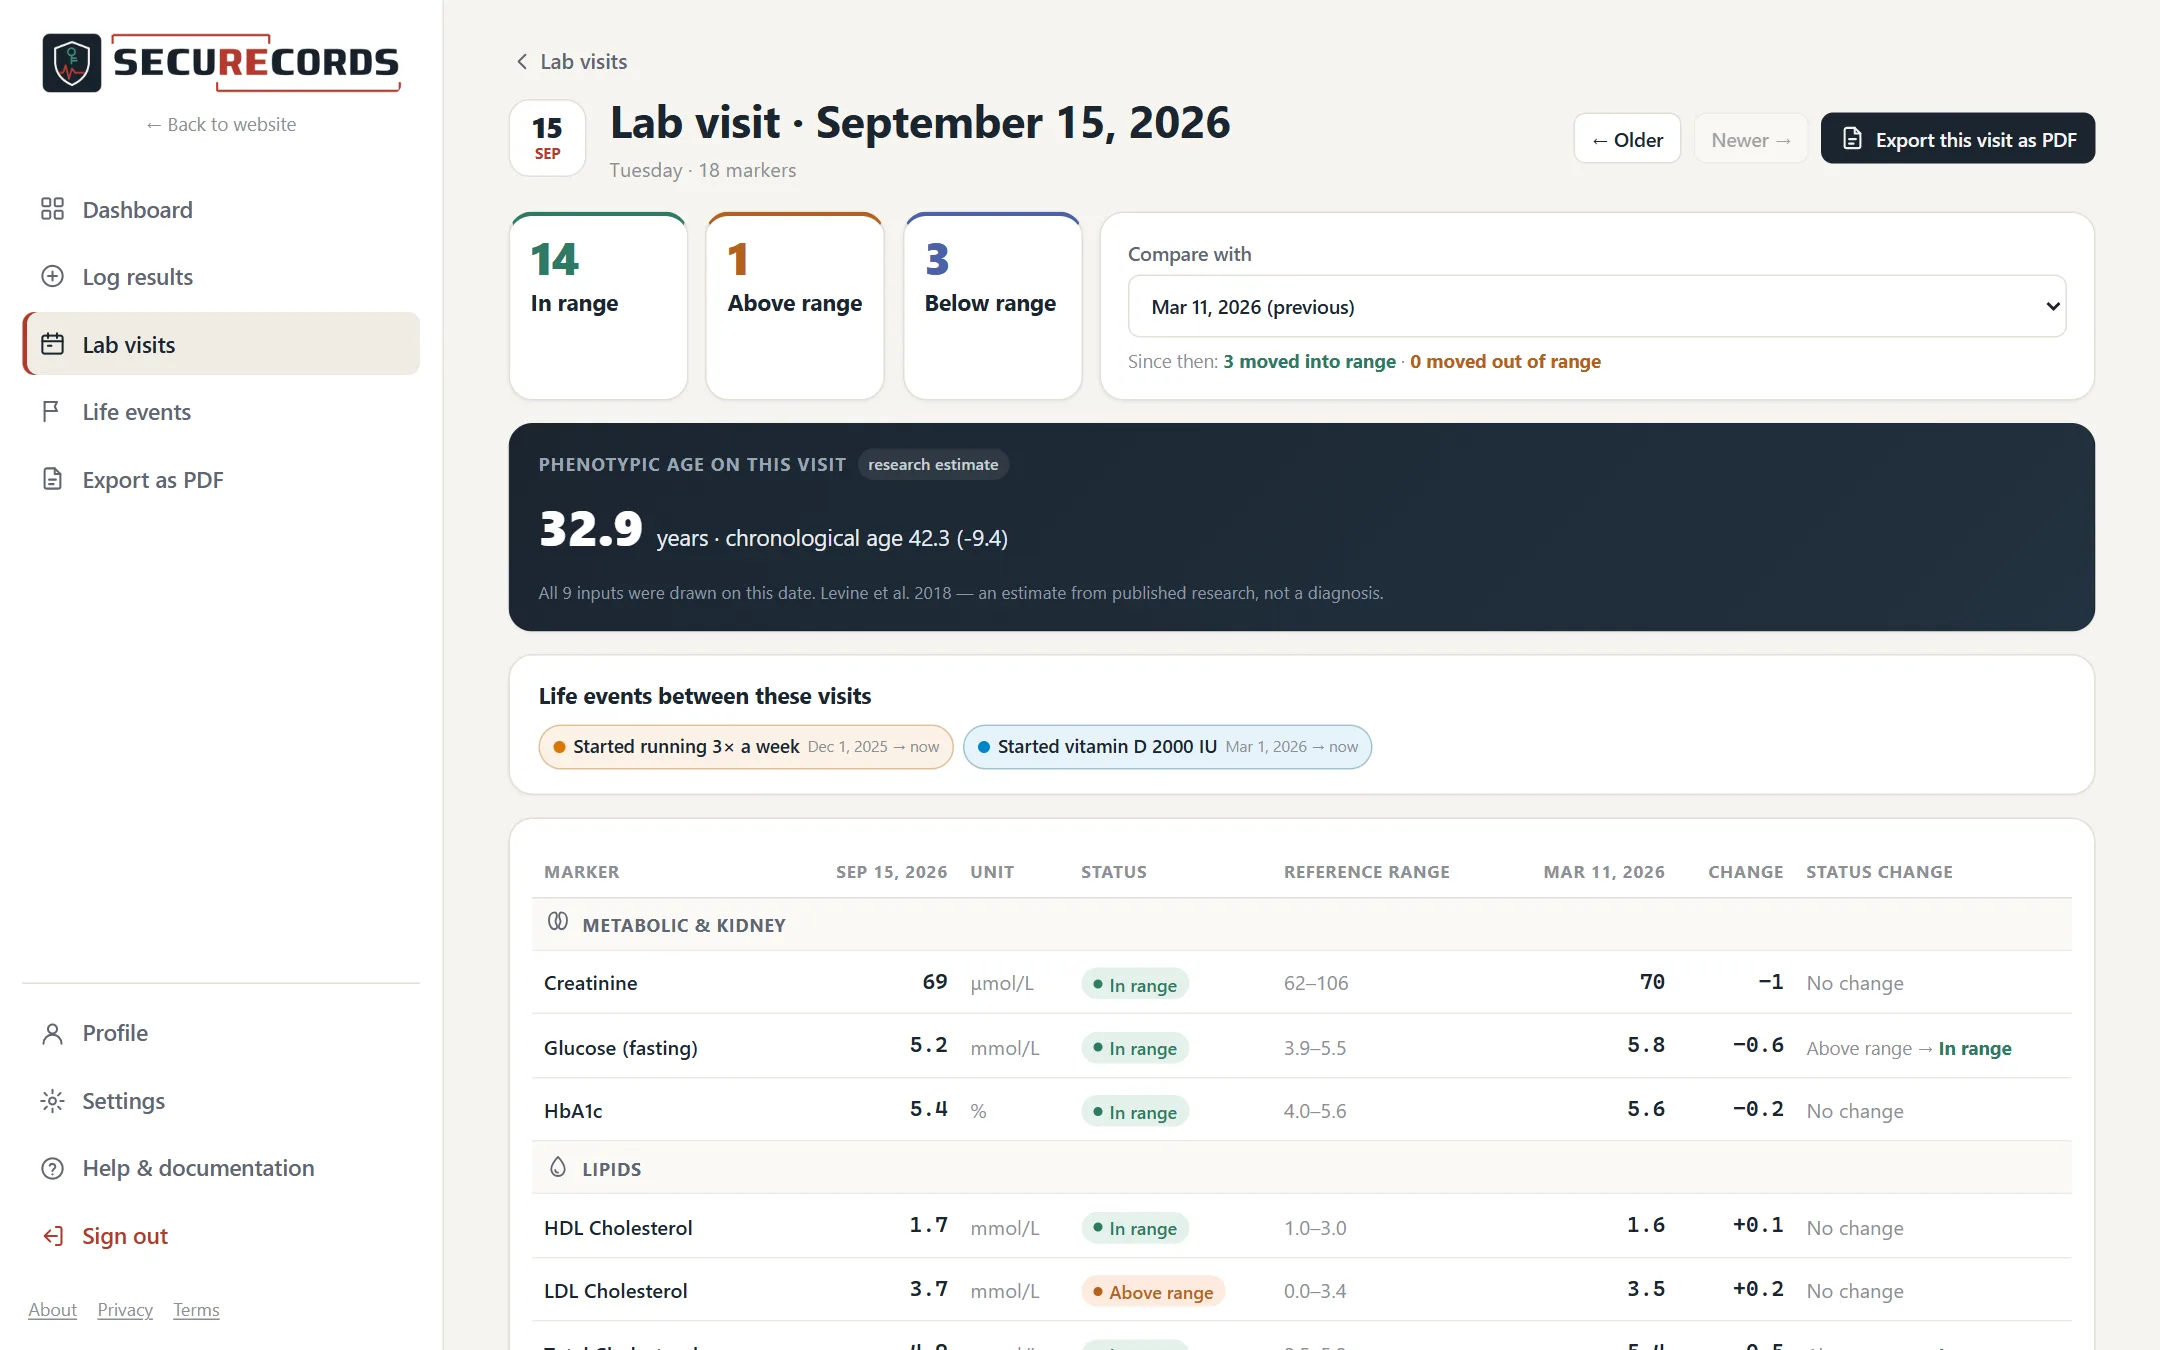
Report cards for every blood draw
Each date with lab results becomes a visit. Compare it with the previous one — or any other — and see what changed at a glance.
Change for every marker, grouped by category
Which markers moved into or out of range
Phenotypic Age for that day, when all inputs were drawn
Export a single visit as a PDF
SECURECORDS
Life events
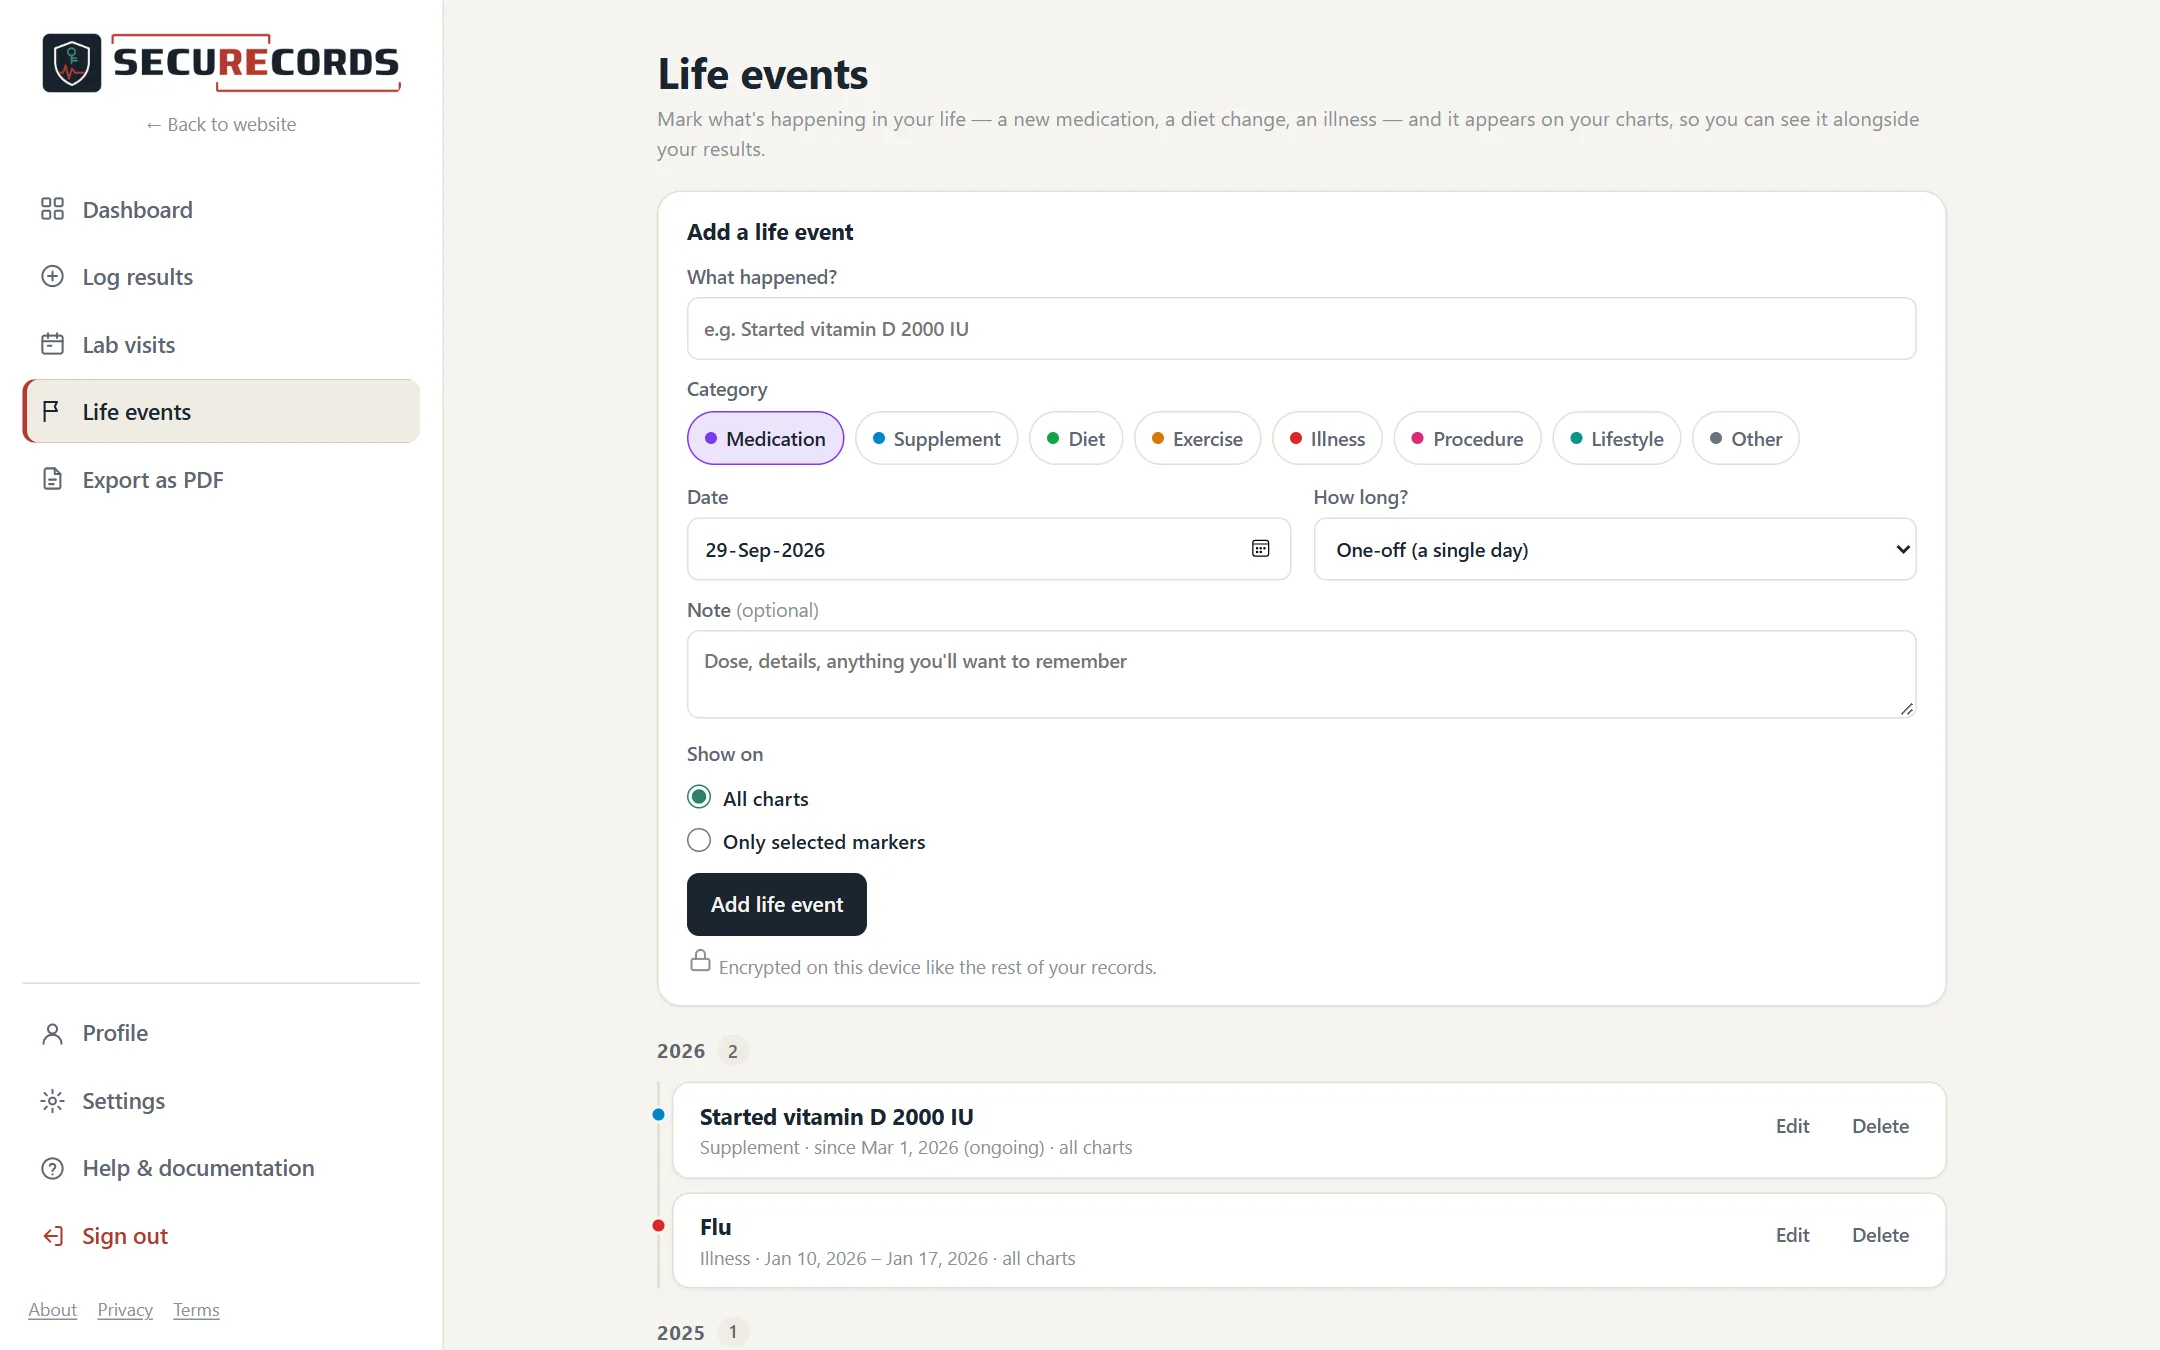
See your results in context
Record what was going on — a new medication or supplement, a diet change, an illness, starting to exercise. Events appear on your charts, so you can see them alongside your results.
One-off events, periods with an end date, or ongoing
Show on every chart or only on the markers you choose
Listed between lab visits and included in PDF reports
Events are your own notes. SECURECORDS never suggests that an event caused a change.
SECURECORDS
Estimates from published research
Phenotypic Age & BMI
Phenotypic Age
A research-based estimate of biological age from Levine et al. (2018), calculated from your age and nine routine blood markers. See it on your dashboard and for each lab visit where all nine were measured.
An estimate from published research — not a diagnosis.
BMI with WHO categories
BMI from your weight and height, shown against the standard adult categories published by the World Health Organization (also used by Health Canada and the US CDC), with the source cited.
BMI doesn't distinguish muscle from fat and applies to adults.
Reports & exports
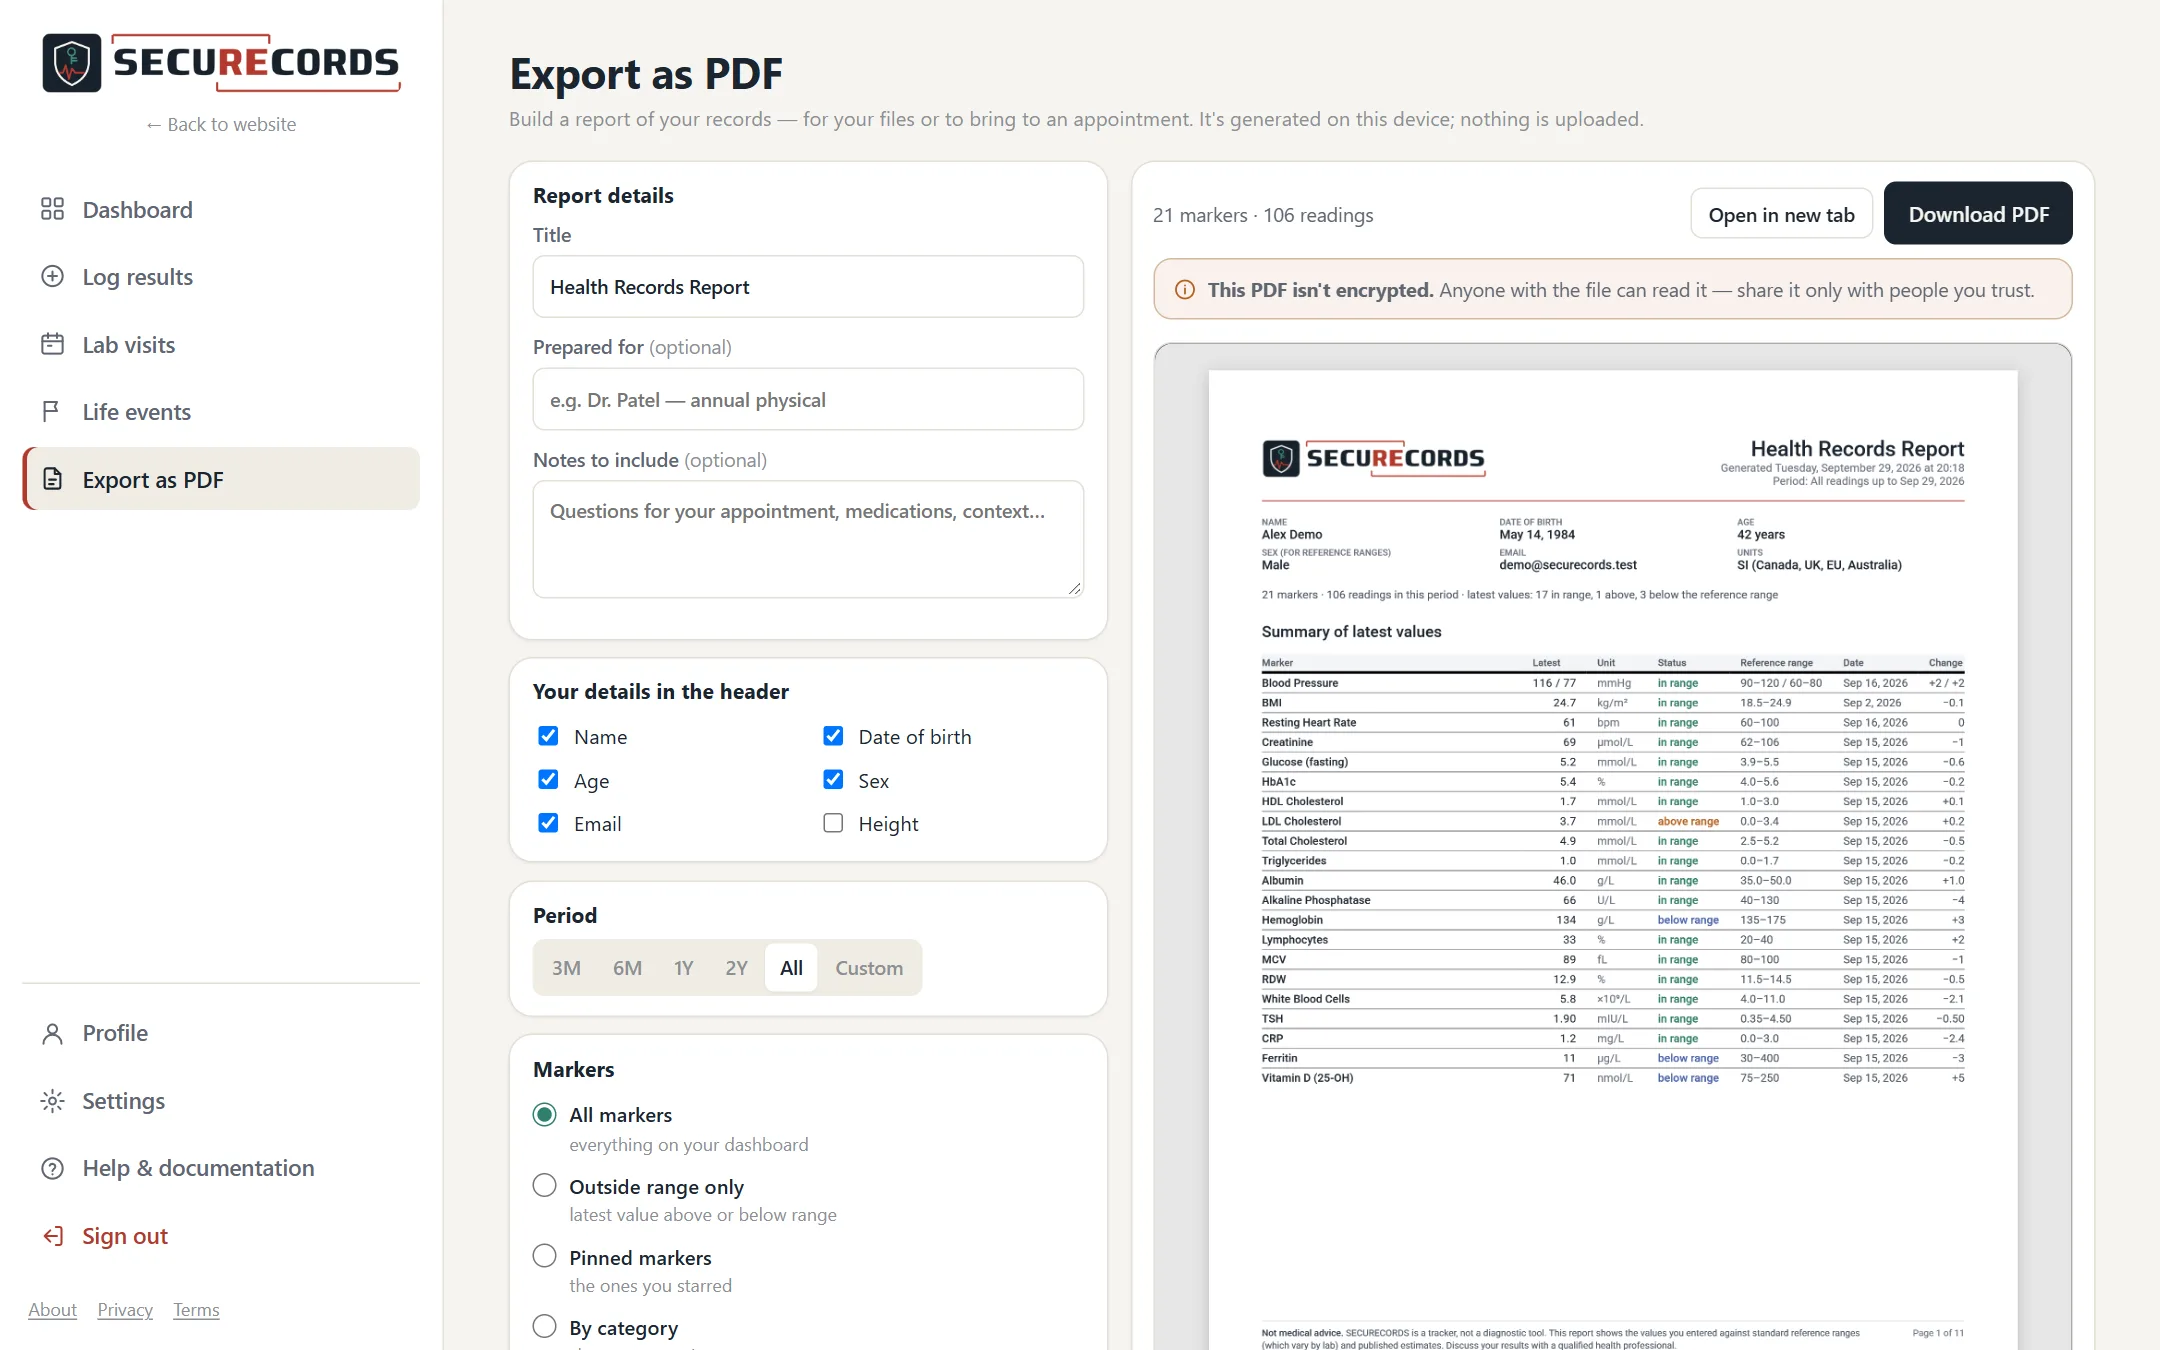
Bring your results to your appointment
Create a PDF with a live preview: choose the period, the markers and the sections, add notes for your doctor, and download. It's built on your device — nothing is uploaded.
Summary table, trend charts, readings, Phenotypic Age, BMI and life events
SI or US units, Letter or A4
A complete download of all your data (JSON) on every plan
SECURECORDS
Units & comfort
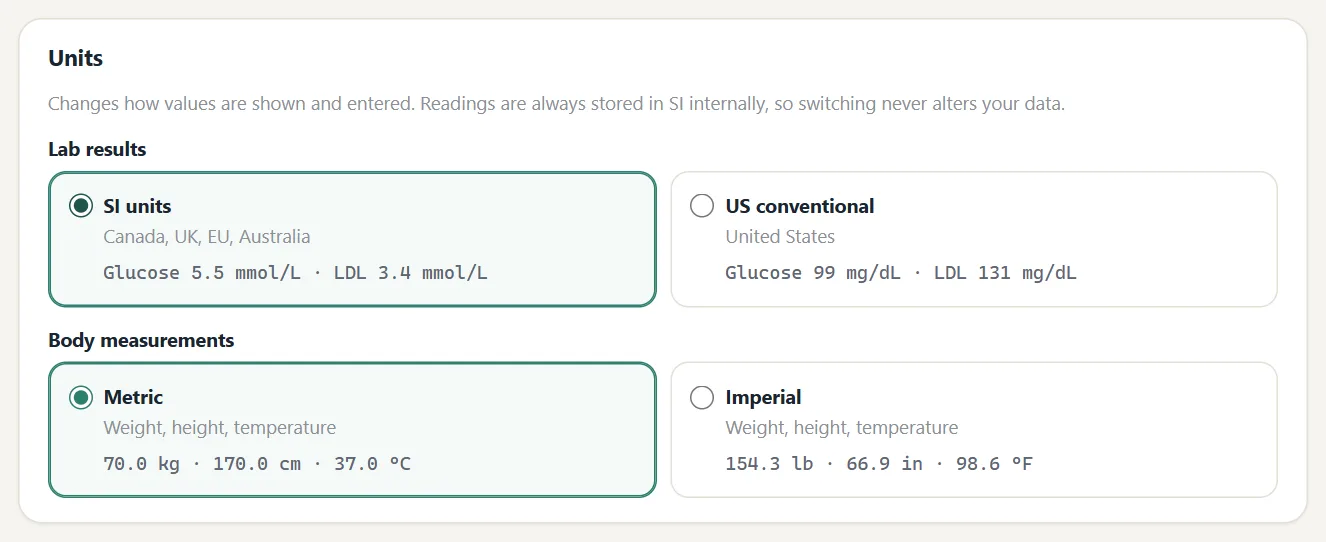
Your units, your way
SI units (Canada, UK, EU, Australia) or US conventional units
Metric or imperial body measurements
Switch any time — your stored data never changes
Light and dark themes, and a layout built for phones
Automatic lock after inactivity
SECURECORDS
What you can track
54 built-in markers & vitals
Plus your own custom biomarkers for anything that isn't listed.
Vitals
Blood Pressure
BMI
Blood Glucose (home meter, fasting)
Resting Heart Rate
Oxygen Saturation (SpO₂)
Body Temperature
Metabolic & Kidney
Glucose (fasting)
HbA1c
Sodium
Potassium
Chloride
Bicarbonate (CO2)
Urea (BUN)
Creatinine
eGFR
Calcium
Magnesium
Phosphate
Lipids
Total Cholesterol
LDL Cholesterol
HDL Cholesterol
Triglycerides
Liver
Albumin
Alkaline Phosphatase
ALT
AST
GGT
Total Bilirubin
Total Protein
CBC
White Blood Cells
Red Blood Cells
Hemoglobin
Hematocrit
MCV
MCH
MCHC
RDW
Platelets
Lymphocytes
Neutrophils
Monocytes
Eosinophils
Basophils
Thyroid
TSH
Free T4
Free T3
Inflammation
CRP
ESR
Vitamins & Minerals
Vitamin D (25-OH)
Vitamin B12
Folate
Ferritin
Iron
TIBC
Start free — upgrade for PDF reports, more history and family profiles.